Below are given
back testing results of V2, generated by the back testing software. These results should be considered as
extrapolation into the past of V2 - Volatility Trading Program, which started
live trading on December 1, 2015. Performance fees (20% of new net profit
above high water mark) are not deducted from back testing results.
To see actual trading results, please go to the Performance page.
Back testing results
can be found in this spreadsheet.
Results do take into account bid/ask spreads and negative interest on borrowed
equity (sold short).
V2 Features:
- The back testing history goes back 60 months (the entire available history of the traded instruments was used),
and the results for this strategy are very promising. The variability of returns is low and the
Sharpe Ratio is excellent. The strategy is extremely robust i.e. relatively insensitive
to parameter changes (it is not a curve fitted, or over optimized
system), which usually anticipates excellent performance in forward trading,
following the back testing period.
- Transaction costs are very low (only 1.8% of
net asset value per annum), relative to average annualized rate of return
(around 10% per annum). These calculations are based on a $100,000 test account.
In larger accounts, the efficiency should be somewhat better.
- The strategy trades
liquid instruments (VXX and XIV ETNs) and has moderate capacity. The unavailability to sell
short stock at certain times was not taken into account.
- The strategy is minimally affected by price
slippage, as it trades liquid trading instruments and makes relatively small
position adjustments during the trading day. Hence, the actual trading results are very close to hypothetical
results. See "Transaction costs" above.
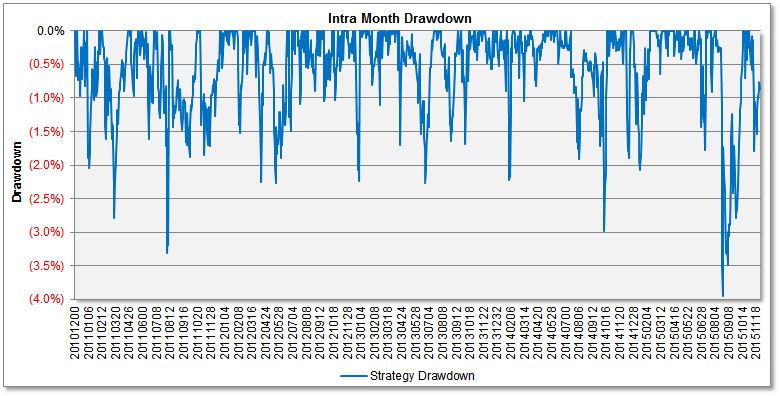
- V2 has relatively shallow drawdowns and, due to
the excellent profitability in back testing, the strategy should recovers
relatively fast.
- Back testing results do take into account the
interest paid on "hard to borrow" shares. As of November 2015 the average interest
on open positions was around 4.4% per year at Interactive Brokers.
- Larger annualized returns can be obtained by
employing portfolio margin and additional leverage in accounts funded in excess of $100,000 (with
Interactive Brokers).
V2 -
HYPOTHETICAL PERFORMANCE REPORT FROM STRATEGY BACK TESTING
1. Monthly Rates
of Return (ROR), Before Performance Fees
Jan
Feb
Mar
Apr
May
Jun
Jul
Aug
Sep
Oct
Nov
Dec
Total
VAMI
2010
-
-
-
-
-
-
-
-
-
-
-
2.21%
2.21%
1,022.1
2011
0.88%
0.89%
(0.44%)
2.06%
0.34%
0.15%
(0.48%)
0.64%
(1.00%)
1.93%
(0.13%)
1.33%
6.29%
1,086.4
2012
1.91%
1.21%
3.71%
0.50%
(1.00%)
1.70%
2.03%
1.13%
1.68%
0.48%
2.48%
2.81%
20.22%
1,306.1
2013
2.34%
0.55%
1.53%
3.33%
(0.08%)
(1.06%)
2.50%
(1.21%)
0.99%
1.09%
0.74%
0.59%
11.80%
1,460.3
2014
(1.24%)
1.16%
1.01%
(0.01%)
1.36%
0.52%
(1.12%)
0.93%
(0.68%)
2.71%
0.50%
0.28%
5.48%
1,540.4
2015
(0.48%)
2.09%
0.46%
1.34%
0.74%
0.08%
2.13%
(2.40%)
(0.02%)
3.78%
(0.36%)
-
7.47%
1,655.4
2. Performance
Statistics, Based on Back Testing Results (Before Performance Fees)
Strategy Returns (Before
Performance Fees)
Testing
period (60 months)
Dec/2010 -
Nov/2015
Net profit on fixed capital
without/with monthly profit reinvesting
Average annual transaction
costs - bid/ask spreads and commissions and negative
interest (deducted from annual ROR)
6% of NAV
per annum
Average transaction bid/ask spread
and commission cost, as a fraction
of the transaction value (already taken into account)
0.06%
More back testing results, for the three
strategies (V1, V2, V4) combined are available upon request.
PLEASE ANALYZE AND
THOROUGHLY UNDERSTAND THE RISK / DRAWDOWN PARAMETERS ABOVE AND THE DRAWDOWN
CHART BELOW BEFORE YOU DECIDE TO INVEST IN THE PROGRAM. AS WITH ANY TRADING
PROGRAM, THERE IS NO GUARANTEE THE SYSTEM WILL NOT EXCEED THE WORST DRAWDOWN
FROM THE PAST. WE DO NOT RECOMMEND INVESTING MORE THAN 1/3 OF YOUR TOTAL
INVESTMENT PORTFOLIO IN ANY PARTICULAR PROGRAM, INCLUDING V1D - VOLATILITY
TRADING PROGRAM.
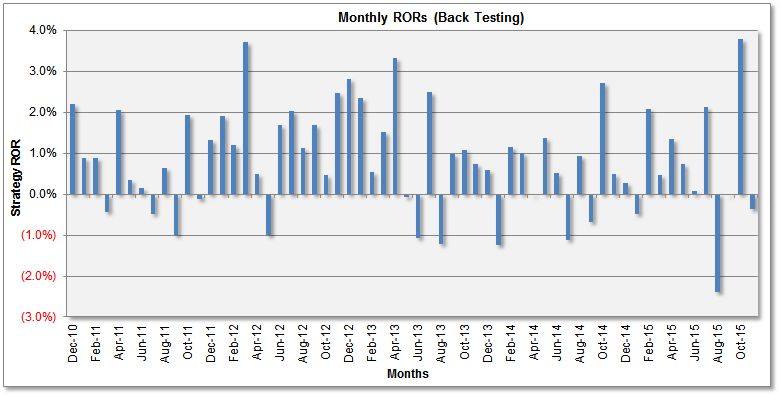
3. Performance Graphs
Monthly Rates of Return (ROR, before
management fees)
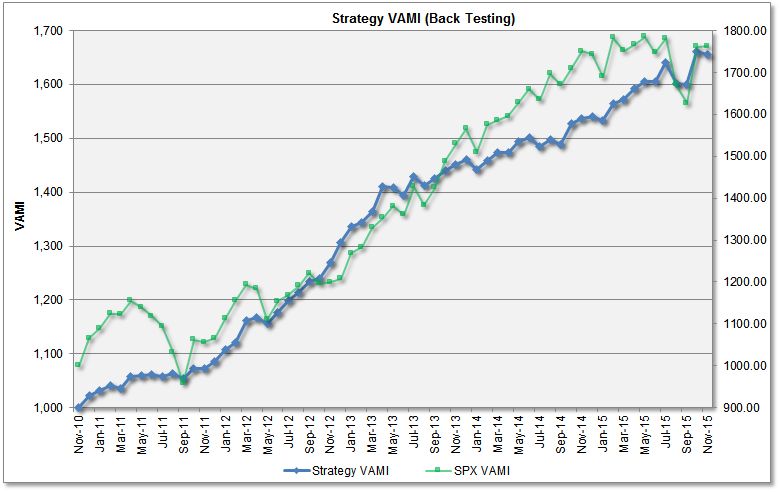
Monthly
Strategy VAMI vs. S&P 500 Index
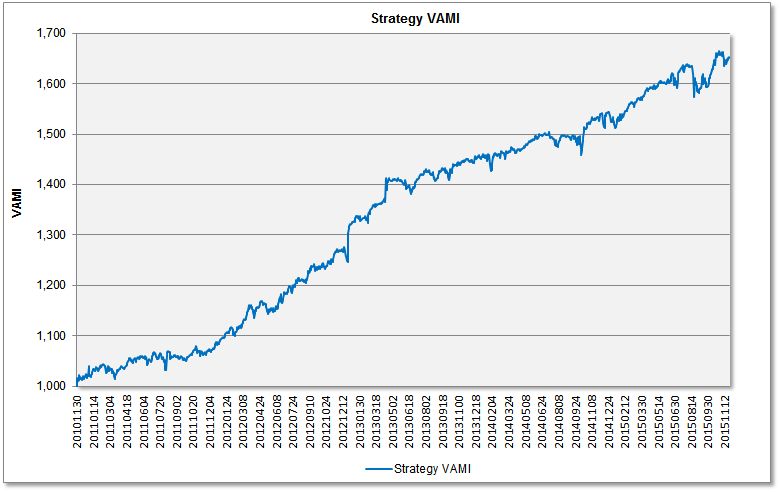
Daily Strategy VAMI vs. S&P 500 Index
Intra-Month Drawdown
Compoundingis an efficient method for increasing your account
equity exponentially, by reinvesting the profit (see the VAMI charts above
and
try this
Financial Calculator).
You can see these
formulas for ROR
calculations and compounding.
The above
tables and charts document V2's historical hypothetical performance
based on back testing results. To see
actual trading results, please go to the Performance page.
Please note
that performance results reported are before performance fees, which
decrease returns. Interest on open positions is not taken into account in
hypothetical results. There may also be slight differences in profit/loss on
different trading platforms.
HYPOTHETICAL OR
SIMULATED PERFORMANCE RESULTS HAVE CERTAIN INHERENT LIMITATIONS. UNLIKE AN
ACTUAL PERFORMANCE RECORD, SIMULATED RESULTS DO NOT REPRESENT ACTUAL TRADING.
ALSO, SINCE THE TRADES HAVE NOT ACTUALLY BEEN EXECUTED, THE RESULTS MAY HAVE
UNDER-OR-OVERCOMPENSATED FOR THE IMPACT, IF ANY, OF CERTAIN MARKET FACTORS, SUCH
AS LACK OF LIQUIDITY. SIMULATED TRADING PLATFORMS IN GENERAL ARE ALSO SUBJECT TO
THE FACT THAT THEY ARE DESIGNED WITH THE BENEFIT OF HINDSIGHT. NO REPRESENTATION
IS BEING MADE THAT ANY ACCOUNT WILL OR IS LIKELY TO ACHIEVE PROFITS OR LOSSES
SIMILAR TO THOSE SHOWN.
Risk Disclaimer
THE RISK OF
LOSS IN TRADING EQUITIES AND ETFS CAN BE SUBSTANTIAL. YOU SHOULD THEREFORE
CAREFULLY CONSIDER WHETHER SUCH TRADING IS SUITABLE FOR YOU IN LIGHT OF YOUR
FINANCIAL CONDITION AND INVESTMENT OBJECTIVES. PAST PERFORMANCE IS NOT
NECESSARILY INDICATIVE OF FUTURE RESULTS. THE PERFORMANCE QUOTED REPRESENTS PAST
PERFORMANCE AND CURRENT PERFORMANCE MAY BE LOWER OR HIGHER. TRADING EQUITIES IS
SPECULATIVE AND MAY INVOLVE THE LOSS OF PRINCIPAL; THEREFORE, FUNDS PLACED UNDER
MANAGEMENT SHOULD BE RISK CAPITAL FUNDS THAT IF LOST WILL NOT SIGNIFICANTLY
AFFECT ONE'S PERSONAL WELL BEING. THIS IS NOT A SOLICITATION TO INVEST AND YOU
SHOULD CAREFULLY CONSIDER YOUR FINANCIAL SITUATION PRIOR TO MAKING ANY
INVESTMENT OR ENTERING INTO ANY TRANSACTION. PLEASE SEE THE COMPLETE
RISK DISCLOSURE.