V2 > Actual Performance
V2 - Volatility Trading Program is based on statistical arbitrage between two volatility trading instruments: the iPath S&P 500 VIX short-term futures Index tracking ETN (VXX) and the Velocity Shares daily inverse VIX short-term tracking ETN (XIV). The prices of these two instruments move in opposite directions, i.e. their price returns are strongly negatively correlated, with a small negative drift. If positions sizes are properly calculated, the strategy attempts to extract profit from this drift. A small portion of the profit is generated from the price contango of VIX futures, if existing. The strategy adjusts portfolio positions once a day, in order to maximize the risk-adjusted daily rate of return. The reported returns are achieved by using the standard margin percentage available with most brokerages. By using portfolio margin, available to accounts with balance higher than $110,000, higher absolute returns can be achieved (keeping the same risk-return ratio).
Beginning from December 2015 on this page we will be tracking the actual performance of the V2 - Volatility Trading Program. To see extrapolation into the past of the currently traded strategy, see the hypothetical performance report from strategy back testing (V2 v.11/2015) on the Backtesting page (from December 2010 to November 2015).
I. PERFORMANCE SUMMARY
ACTUAL TRADING RESULTS (BASED ON PROPRIETARY TRADING)
PAST PERFORMANCE IS NOT NECESSARILY INDICATIVE OF FUTURE RESULTS. THE RISK OF LOSS IN TRADING EQUITIES CAN BE SUBSTANTIAL. YOU SHOULD THEREFORE CAREFULLY CONSIDER WHETHER SUCH TRADING IS SUITABLE FOR YOU IN LIGHT OF YOUR FINANCIAL CONDITION AND INVESTMENT OBJECTIVES.
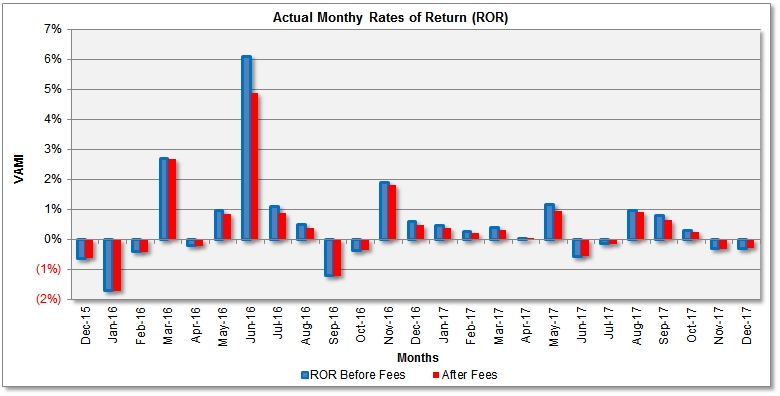
1. Monthly Rates of Return (ROR), Before/After Performance Fees
|
|
Jan |
Feb |
Mar |
Apr |
May |
Jun |
Jul |
Aug |
Sep |
Oct |
Nov |
Dec |
YTD |
VAMI |
|
2015 |
Before December 2015 see back testing results | (0.62%) (0.62%)* | (0.62%) (0.62%)* | 993.8 993.8* | ||||||||||
|
2016 |
(1.72%) (1.72%)* | (0.41%) (0.41%)* | 2.69% 2.69%* | (0.21%) (0.21%)* | 0.96% 0.84%* | 6.11% 4.89%* | 1.10% 0.88%* | 0.50% 0.40%* | (1.20%) (1.20%)* | (0.37%) (0.37%)* | 1.89% 1.83%* | 0.61% 0.49%* | 10.16% 8.22%* | 1,094.7 1,075.4* |
|
2017 |
0.48% 0.38%* | 0.27% 0.21%* | 0.41% 0.33%* | 0.03% 0.03%* | 1.17% 0.94%* | (0.57%) (0.57%)* | (0.14%) (0.14%)* | 0.96% 0.91%* | 0.80% 0.64%* | 0.31% 0.25%* | (0.31%) (0.31%)* | (0.30%) (0.30%)* | 3.14% 2.38%* | 1,129.1 1,101.1* |
|
2018 |
(1.84%) (1.84%)* | The strategy was discontinued as one of the trading instruments (XIV) ceased trading. The strategy was replaced by a new, S&P 500 trading strategy. More details soon at www.equity-quant.com. | (1.84%) (1.84%)* | 1,108.4 1,080.8* | ||||||||||
* - Net of 20% monthly performance fee. Returns are based on pro-forma adjustments to a proprietary account to reflect fees.
The above table shows actual trading results, before and after performance fees. Rates of return (ROR), net of 20% performance fee, are marked by asterisk (*). ROR figures have been calculated according to CFTC Regulation 4.35(a)(6)(i)(F), by dividing the monthly net performance (gain or loss) by the nominal (notional) account size. To see the calculations, open this Excel table. See also this performance fee calculation example in Excel.
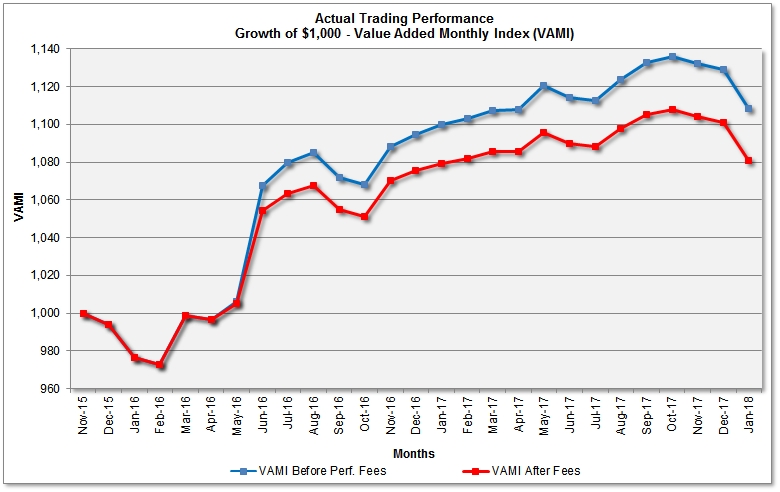
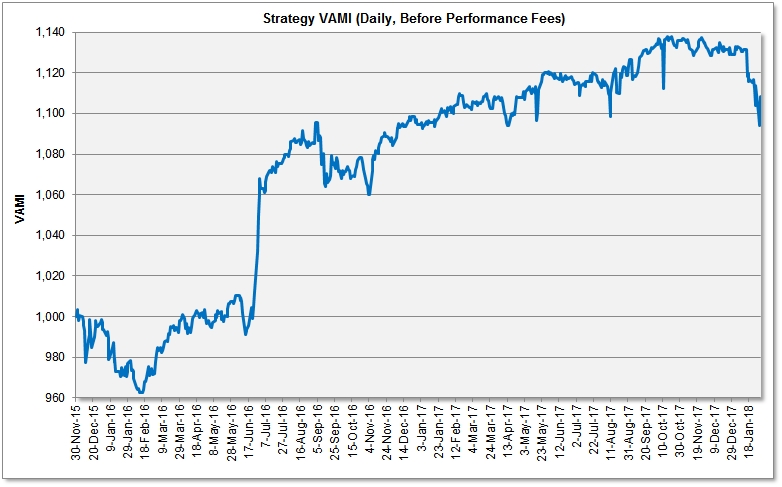
The charts below show monthly rates of return (ROR) and the growth of $1,000 (the Value Added Monthly Index - VAMI), before and after 20% performance/incentive fee deduction. Compounding by monthly profit reinvesting is used.
II. Performance Analytics (Based on Pro-Forma Proprietary Trading Results, Net of 20% Performance Fee)
|
|
||||||||||||||||||||||||||||||||||||||||||||||||||||
Risk Disclaimer
THE RISK OF LOSS IN TRADING CAN BE SUBSTANTIAL. YOU SHOULD THEREFORE CAREFULLY CONSIDER WHETHER SUCH TRADING IS SUITABLE FOR YOU IN LIGHT OF YOUR FINANCIAL CONDITION AND INVESTMENT OBJECTIVES. PAST PERFORMANCE IS NOT NECESSARILY INDICATIVE OF FUTURE RESULTS. THE PERFORMANCE QUOTED REPRESENTS PAST PERFORMANCE AND CURRENT PERFORMANCE MAY BE LOWER OR HIGHER. EQUITY TRADING IS SPECULATIVE AND MAY INVOLVE THE LOSS OF PRINCIPAL; THEREFORE, FUNDS PLACED UNDER MANAGEMENT SHOULD BE RISK CAPITAL FUNDS THAT IF LOST WILL NOT SIGNIFICANTLY AFFECT ONE'S PERSONAL WELL BEING. THIS IS NOT A SOLICITATION TO INVEST AND YOU SHOULD CAREFULLY CONSIDER YOUR FINANCIAL SITUATION PRIOR TO MAKING ANY INVESTMENT OR ENTERING INTO ANY TRANSACTION.
![]() BACK TO THE MAIN PERFORMANCE PAGE
BACK TO THE MAIN PERFORMANCE PAGE