V3 > Back Testing Results (V3 version 12/2018)
Below are given back testing results of V3, generated by the back testing software. These results should be considered as extrapolation into the past of V3 - Volatility Trading Program, which started live trading on January 1, 2019. Performance fees (20% of new net profit above high water mark) were not deducted from back testing returns. To see actual trading results, please visit the Performance page (beginning January 2019).
Back testing results (of the latest, currently traded strategy) can be found in this spreadsheet (ver.12/2018). Results do not take into account bid/ask spreads (see the third table below) and interest on fixed income securities that can be hold in the account. Actual annualized rates of return (before performance fees) should be around 92% of theoretical returns.
V3 Features:
- Based on 119 months of back testing history, the strategy looks very promising. The variability of returns is relatively low and the Sharpe Ratio is excellent. The strategy is extremely robust i.e. relatively insensitive to parameter changes (it is not a curve fitted, or over optimized system), which usually anticipates excellent performance in forward trading, after the back testing period.
- Transaction costs and negative interest (on hard-to-borrow equity) are very low (only 1% of net asset value per annum), relative to average annualized rate of return (around 13% per annum). Since bid/ask spread costs and interest are around 1/13 of the theoretical return, actual rates of return should be around 92% of theoretical returns. In larger accounts the efficiency is even better.
- The strategy trades liquid instruments (VXXB ETNs or CFDs) and has large capacity. By gradually accumulating positions during the trading day the strategy can trade accounts of virtually any size without performance degradation.
- The strategy is not much affected by price slippage, as it trades liquid trading instruments and makes relatively small position adjustments during the trading day. Hence, the actual trading results are very close to hypothetical results. See "Transaction costs" above.
- V3 has relatively shallow drawdowns and, due to the excellent profitability, back testing says the strategy recovers relatively fast after drawdowns.
V3 Strategy Description
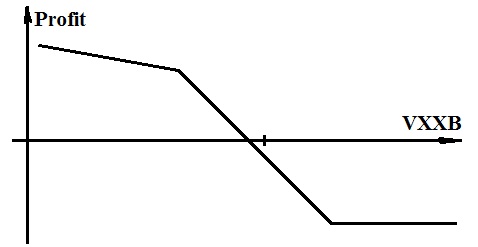
The V3 strategy attempts to profit from contango in VIX futures term structure. Due to contango effect the price in VXXB ETNs/CFDs tends to decrease over time (most of the time). During periods of rising VIX, VXXB tends to rise more rapidly than when it drops, but these periods are relatively short. To take advantage of this kind of VXXB price behavior, we would like to hold a modified reverse collar position with VXXB options - see the sketch below.
Fig. 1 (above) - Modified reverse collar payout diagram
We found that this kind of options strategy (with high probability) expires profitable, particularly if options with longer expirations (LEAPs) are used. However, due to unavailability of LEAPs in VXXBs, we decided to replicate this option position with VXXB ETNs or CFDs. The diagram in Fig. 2 shows that the replicated position follows very closely the theoretical reverse collar options position. Multiple reverse collar with different time to expiration are held in the portfolio and each month one collar expires (and is replaced by another one), thus adding to the closed position profit/loss.
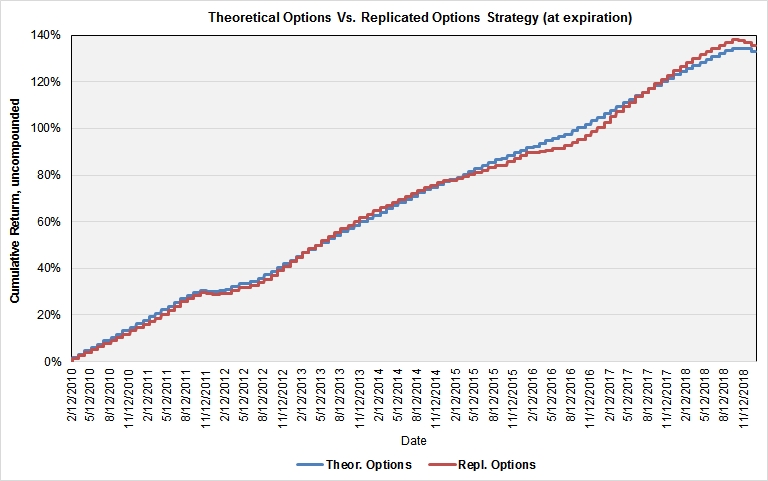
Fig. 2 (above) - Cumulative return (at expiration) of the theoretical options position (blue color line) and replicated position (brick color line)
As long as we know (with high probability) the position will expire profitable, it is easy to accept the open trade profit/loss (on daily basis) - see the diagram in Fig. 3 below. It is remarkable that, over time, the strategy tends to recover from losses, making new equity highs.
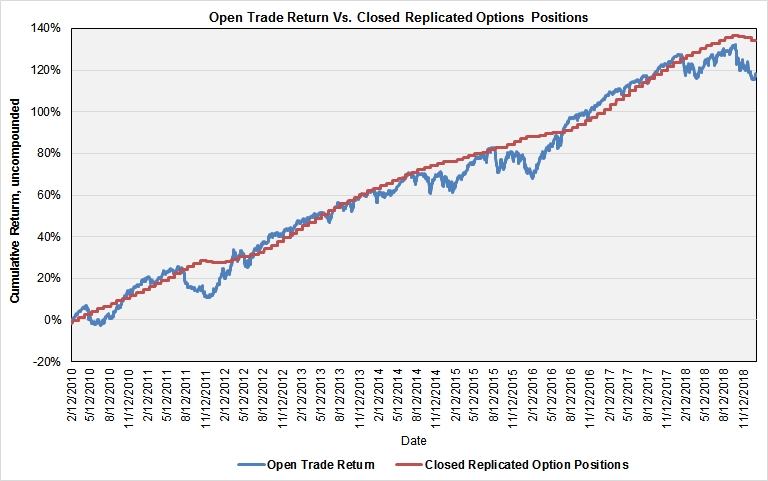
Fig.3 - Open trade cumulative return (blue color line) vs. closed trade cumulative return (brick color line)
V3 Trading Style
The V3 trades usually trades once a day, when it adjusts the VXXB portfolio in order to replicate the complex (multi expiration) options portfolio. There are also automatic intra-day adjustments (stop orders) which are activated in days with extreme up-moves in VXXB. The trading frequency is rather low, in order to minimize transaction costs and improve the strategy efficiency.
V3 - HYPOTHETICAL PERFORMANCE REPORT FROM STRATEGY BACK TESTING
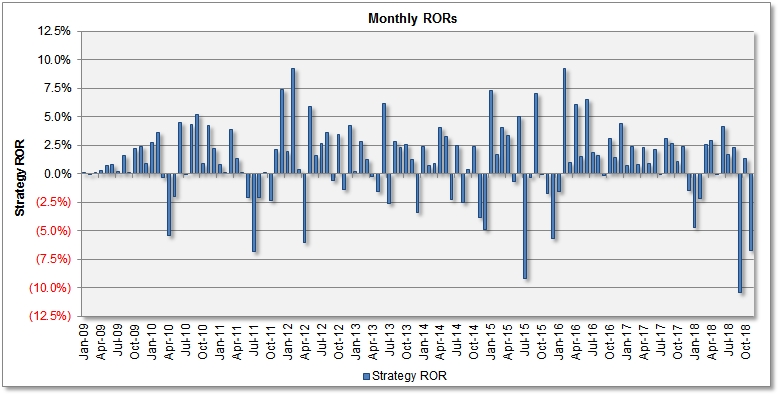
1. Monthly Rates of Return (ROR), Before Performance Fees
|
|
Jan |
Feb |
Mar |
Apr |
May |
Jun |
Jul |
Aug |
Sep |
Oct |
Nov |
Dec |
Total |
VAMI |
|
2009 |
- | 0.01% | (0.03%) | 0.10% | 0.29% | 0.72% | 0.84% | 0.20% | 1.64% | 0.08% | 2.21% | 2.44% | 8.79% | 1,087.9 |
|
2010 |
0.93% | 2.79% | 3.60% | (0.35%) | (5.38%) | (1.97%) | 4.52% | (0.03%) | 4.33% | 5.22% | 0.95% | 4.27% | 19.95% | 1,304.9 |
|
2011 |
2.27% | 0.84% | 0.08% | 3.90% | 1.37% | 0.10% | (2.07%) | (6.78%) | (2.07%) | 0.08% | (2.37%) | 2.14% | (2.90%) | 1,267.1 |
|
2012 |
7.41% | 1.98% | 9.20% | 0.38% | (6.00%) | 5.92% | 1.66% | 2.64% | 3.61% | (0.55%) | 3.42% | (1.34%) | 31.15% | 1,661.7 |
|
2013 |
4.25% | 0.23% | 2.83% | 1.24% | (0.25%) | (1.56%) | 6.16% | (2.61%) | 2.85% | 2.29% | 2.62% | 1.25% | 20.72% | 2,006.1 |
|
2014 |
(3.37%) | 2.41% | 0.78% | 0.94% | 4.04% | 3.29% | (2.28%) | 2.45% | (2.53%) | 0.38% | 2.41% | (3.81%) | 4.38% | 2,093.9 |
|
2015 |
(4.84%) | 7.33% | 1.74% | 4.03% | 3.41% | (0.64%) | 5.08% | (9.13%) | (0.30%) | 7.03% | (0.03%) | (1.73%) | 11.16% | 2,327.5 |
|
2016 |
(5.70%) | (1.52%) | 9.22% | 1.04% | 6.09% | 1.52% | 6.56% | 1.92% | 1.59% | (0.15%) | 3.12% | 1.40% | 27.15% | 2,959.4 |
|
2017 |
4.39% | 0.78% | 2.43% | 0.81% | 2.32% | 0.89% | 2.18% | (0.02%) | 3.14% | 2.63% | 1.09% | 2.42% | 25.55% | 3,715.7 |
|
2018 |
(1.43%) | (4.72%) | (2.14%) | 2.55% | 2.94% | (0.05%) | 4.15% | 1.73% | 2.31% | (10.43%) | 1.32% | (6.70%) | (11.00%) | 3,307.0 |
|
2019 |
Start of real trading in January 2019 - see the Real Trading Results | |||||||||||||
2. Back Testing Performance Statistics (Before Performance Fees)
|
|
||||||||||||||||||||||||||||||||||||||||||||||||||||||||||||||||||||
|
|
||||||||||||||||||||||||||||
To see more back testing results, download this Excel spreadsheet (V3 - V.12/2018). Explore all Excel worksheets (click the tabs at the bottom) and scroll down all worksheets to see graphs and performance analytics.
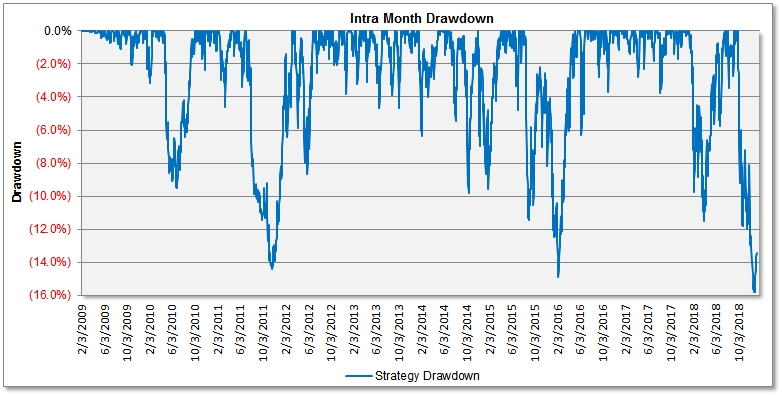
PLEASE ANALYZE AND THOROUGHLY UNDERSTAND THE RISK / DRAWDOWN PARAMETERS ABOVE AND THE DRAWDOWN CHART BELOW BEFORE YOU DECIDE TO INVEST IN THE PROGRAM. AS WITH ANY TRADING PROGRAM, THERE IS NO GUARANTEE THE SYSTEM WILL NOT EXCEED THE WORST DRAWDOWN FROM THE PAST. WE DO NOT RECOMMEND INVESTING MORE THAN 1/3 OF YOUR TOTAL INVESTMENT PORTFOLIO IN ANY PARTICULAR PROGRAM, INCLUDING V3 - VOLATILITY TRADING PROGRAM.
3. Performance Graphs and Histograms
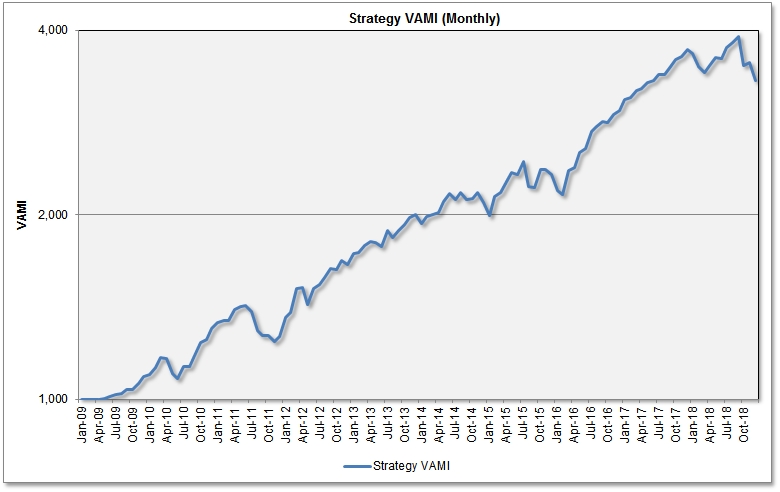
Compounding is an efficient method for increasing your account equity exponentially, by reinvesting the profit (see the VAMI chart above). You can see these formulas for ROR calculations and compounding. By reinvesting profits and compounding monthly, a $50,000 principal (without yearly additions, at 12% annual ROR, after fees) can grow into $1,000,000 in 25 years - try this Financial Calculator.
The above tables and charts document V3's historical hypothetical performance based on back testing results. To see actual trading results, please go to the Performance page.
Please note that performance results reported are before performance fees, which decrease returns. Interest on open positions is not taken into account in hypothetical results. There may also be slight differences in profit/loss with different brokers, due to different commisions.
Better results (smaller drawdown and better Sharpe and Sortino Ratio) can be obtained by trading the V1 and V3 Volatility Trading Programs combined. These Volatility Trading Programs can be further combined with our four currency trading programs (FX Quant 11, FX Index Arb, FX Basket Quant) - see this 7-strategy composite back testing report.
Hypothetical Performance Disclaimer:
HYPOTHETICAL OR SIMULATED PERFORMANCE RESULTS HAVE CERTAIN INHERENT LIMITATIONS. UNLIKE AN ACTUAL PERFORMANCE RECORD, SIMULATED RESULTS DO NOT REPRESENT ACTUAL TRADING. ALSO, SINCE THE TRADES HAVE NOT ACTUALLY BEEN EXECUTED, THE RESULTS MAY HAVE UNDER-OR-OVERCOMPENSATED FOR THE IMPACT, IF ANY, OF CERTAIN MARKET FACTORS, SUCH AS LACK OF LIQUIDITY. SIMULATED TRADING PLATFORMS IN GENERAL ARE ALSO SUBJECT TO THE FACT THAT THEY ARE DESIGNED WITH THE BENEFIT OF HINDSIGHT. NO REPRESENTATION IS BEING MADE THAT ANY ACCOUNT WILL OR IS LIKELY TO ACHIEVE PROFITS OR LOSSES SIMILAR TO THOSE SHOWN.
Risk Disclaimer
THE RISK OF LOSS IN TRADING EQUITIES AND ETFS CAN BE SUBSTANTIAL. YOU SHOULD THEREFORE CAREFULLY CONSIDER WHETHER SUCH TRADING IS SUITABLE FOR YOU IN LIGHT OF YOUR FINANCIAL CONDITION AND INVESTMENT OBJECTIVES. PAST PERFORMANCE IS NOT NECESSARILY INDICATIVE OF FUTURE RESULTS. THE PERFORMANCE QUOTED REPRESENTS PAST PERFORMANCE AND CURRENT PERFORMANCE MAY BE LOWER OR HIGHER. TRADING EQUITIES IS SPECULATIVE AND MAY INVOLVE THE LOSS OF PRINCIPAL; THEREFORE, FUNDS PLACED UNDER MANAGEMENT SHOULD BE RISK CAPITAL FUNDS THAT IF LOST WILL NOT SIGNIFICANTLY AFFECT ONE'S PERSONAL WELL BEING. THIS IS NOT A SOLICITATION TO INVEST AND YOU SHOULD CAREFULLY CONSIDER YOUR FINANCIAL SITUATION PRIOR TO MAKING ANY INVESTMENT OR ENTERING INTO ANY TRANSACTION. PLEASE SEE THE COMPLETE RISK DISCLOSURE.
![]() BACK TO THE MAIN PERFORMANCE PAGE
BACK TO THE MAIN PERFORMANCE PAGE