V4 > Actual Performance
V4 - Volatility Trading Program attempts to extract profit from the price contango of VIX (S&P 500 volatility index) futures. Most of the time it trades the iPath S&P 500 VIX short-term futures Index tracking ETN (VXXB) on the short side. In a slow market, the strategy trades no more than once a day. In a fast market, during periods of sharp market sell-off, the strategy uses stop loss orders. The strategy uses proprietary algorithm to identify contango condition in the VIX futures market. Trading is underleveraged (i.e. the margin amount is much lower than account balance) in order to keep the drawdowns at acceptable levels. The reported rates of return are achieved using the standard portfolio exposure (the 1X program). Higher absolute returns, with proportionally higher drawdowns, can be achieved by using increased leverage (1.5X or 2X version of the program) which we do not recommend. Due to the low margin requirements, partial account funding is feasible.
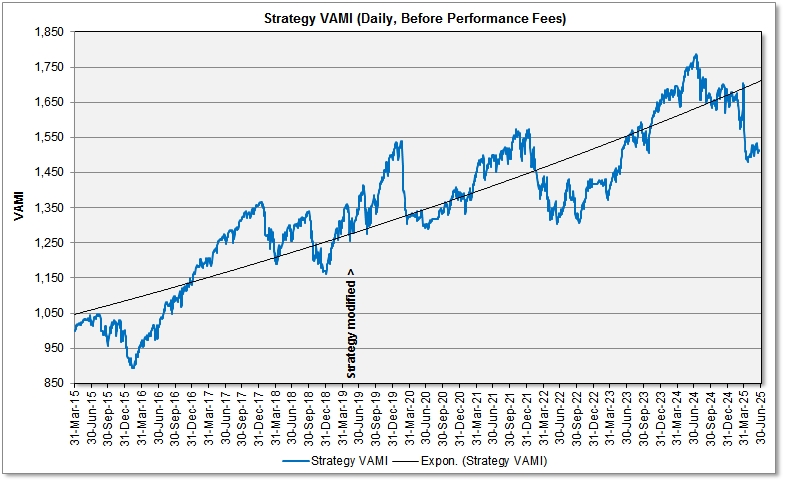
Beginning from April 2015 on this page we are tracking the actual performance of the V4 - Volatility Trading Program. In December 2018 the V4 was modified and replaced by a newer version in January 2019. To see extrapolation into the past of the currently traded strategy, see the hypothetical performance report from strategy back testing (V3 ver.12/2018) on the V3 Back Testing page (from February 2009 to Dec 2018).
I. PERFORMANCE SUMMARY
PAST PERFORMANCE IS NOT NECESSARILY INDICATIVE OF FUTURE RESULTS. THE RISK OF LOSS IN TRADING EQUITIES CAN BE SUBSTANTIAL. YOU SHOULD THEREFORE CAREFULLY CONSIDER WHETHER SUCH TRADING IS SUITABLE FOR YOU IN LIGHT OF YOUR FINANCIAL CONDITION AND INVESTMENT OBJECTIVES.
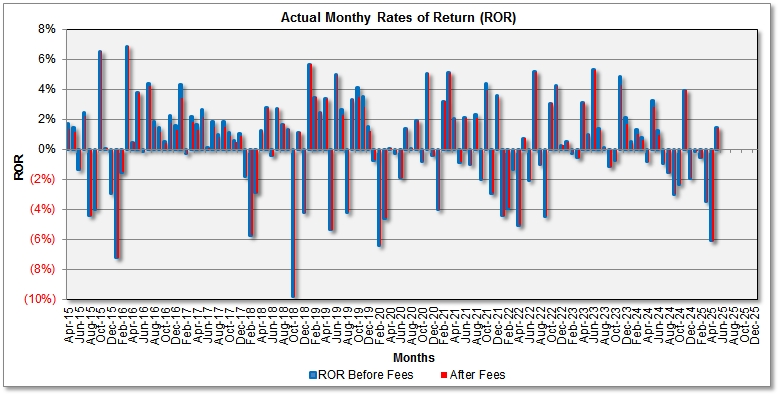
1. Monthly Rates of Return (ROR), Before/After Performance Fees
|
|
Jan |
Feb |
Mar |
Apr |
May |
Jun |
Jul |
Aug |
Sep |
Oct |
Nov |
Dec |
YTD |
VAMI |
|
2015 |
1.74% 1.39%* | 1.47% 1.18%* | (1.31%) (1.31%)* | 2.48% 2.26%* | (4.41%) (4.41%)* | (3.98%) (3.98%)* | 6.55% 6.55%* | 0.01% 0.01%* | (2.92%) (2.92%)* | (0.87%) (1.72%)* | 991.3 982.8* | |||
|
2016 |
(7.22%) (7.22%)* | (1.54%) (1.54%)* | 6.87% 6.87%* | 0.48% 0.48%* | 3.77% 3.77%* | (0.14%) (0.14%)* | 4.39% 4.24%* | 1.83% 1.46%* | 1.44% 1.15%* | 0.54% 0.43%* | 2.23% 1.79%* | 1.58% 1.26%* | 14.44% 12.57%* | 1,134.4 1,106.4* |
|
2017 |
4.29% 3.43%* | (0.30%) (0.30%)* | 2.18% 1.81%* | 1.63% 1.31%* | 2.68% 2.15%* | 0.12% 0.09%* | 1.88% 1.51%* | 1.00% 0.80%* | 1.83% 1.46%* | 1.09% 0.87%* | 0.61% 0.49%* | 1.07% 0.86%* | 19.57% 15.41%* | 1,356.4 1,276.9* |
|
2018 |
(1.80%) (1.80%)* | (5.71%) (5.71%)* | (2.88%) (2.88%)* | 1.23% 1.23%* | 2.77% 2.77%* | (0.42%) (0.42%)* | 2.75% 2.75%* | 1.66% 1.66%* | 1.35% 1.35%* | (9.81%) (9.81%)* | 1.13% 1.13%* | (4.23%) (4.23%)* | (13.85%) (13.85%)* | 1,168.5 1,100.0* |
|
2019 |
5.68% 5.68%* | 3.48% 3.48%* | 2.48% 2.48%* | 3.38% 3.38%* | (5.34%) (5.34%)* | 4.99% 4.99%* | 2.67% 2.31%* | (4.20%) (4.20%)* | 3.35% 3.35%* | 4.09% 3.48%* | 3.51% 2.81%* | 1.56% 1.24% | 28.06% 25.61%* | 1,496.4 1,381.7* |
|
2020 |
(0.71%) (0.71%)* | (6.39%) (6.39%)* | (4.58%) (4.58%)* | 0.04% 0.04%* | (0.26%) (0.26%)* | (1.89%) (1.89%)* | 1.36% 1.36%* | 0.06% 0.06%* | 1.92% 1.92%* | (0.79%) (0.79%)* | 5.05% 5.05%* | (0.42%) (0.42%)* | (6.86%) (6.86%)* | 1,393.7 1,286.9* |
|
2021 |
(4.02%) (4.02%)* | 3.19% 3.19%* | 5.09% 5.09%* | 2.03% 2.03%* | (0.85%) (0.85%)* | 2.13% 2.10%* | (1.01%) (1.01%)* | 2.31% 2.06%* | (1.99%) (1.99%)* | 4.39% 3.93%* | (2.92%) (2.92%)* | 3.60% 3.49% | 12.08% 11.14%* | 1,562.0 1,430.3* |
|
2022 |
(4.43%) (4.43%)* | (3.93%) (3.93%)* | (1.36%) (1.36%)* | (5.05%) (5.05%)* | 0.75% 0.75%* | (2.05%) (2.05%)* | 5.16% 5.16%* | (1.03%) (1.03%)* | (4.46%) (4.46%)* | 3.08% 3.08%* | 4.23% 4.23%* | 0.26% 0.26%* | (9.10%) (9.10%)* | 1,419.6 1,299.9* |
|
2023 |
0.51% 0.51%* | (0.25%) (0.25%)* | (0.55%) (0.55%)* | 3.10% 3.10%* | 0.99% 0.99%* | 5.30% 5.30%* | 1.42% 1.26%* | 0.14% 0.11%* | (1.15%) (1.15%)* | (0.75%) (0.75%)* | 4.89% 4.30%* | 2.09% 1.67%* | 16.65% 15.32%* | 1,655.9 1,499.0* |
|
2024 |
0.50% 0.40%* | 1.30% 1.04%* | 0.81% 0.65%* | (0.81%) (0.81%)* | 3.28% 2.79%* | 1.23% 0.98%* | (0.92%) (0.92%)* | (1.56%) (1.56%)* | (2.99%) (2.99%)* | (2.34%) (2.34%)* | 3.94% 3.94%* | 2.22% 0.96%* | 1,692.6 1,513.4* | |
* - Net of 20% monthly performance fee.
- Former (V4) version of the strategy
The above table shows actual trading results, before and after performance fees. Rates of return (ROR), net of 20% performance fee, are marked by asterisk (*). ROR figures have been calculated according to CFTC Regulation 4.35(a)(6)(i)(F), by dividing the monthly net performance (gain or loss) by the nominal (notional) account size. To see the calculations, open this Excel table. See also this performance fee calculation example in Excel.
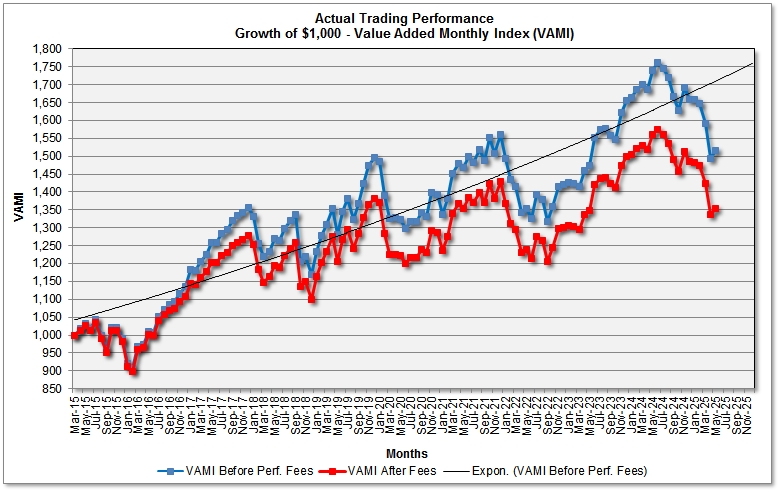
The charts below show monthly rates of return (ROR) and the growth of $1,000 (the Value Added Monthly Index - VAMI), before and after 20% performance/incentive fee deduction. Compounding by monthly profit reinvesting is used.
II. Performance Analytics (Based on Real Trading Results, Net of 20% Performance Fee)
|
|
||||||||||||||||||||||||||||||||||||||||||||||||||||||
Risk Disclaimer
THE RISK OF LOSS IN TRADING CAN BE SUBSTANTIAL. YOU SHOULD THEREFORE CAREFULLY CONSIDER WHETHER SUCH TRADING IS SUITABLE FOR YOU IN LIGHT OF YOUR FINANCIAL CONDITION AND INVESTMENT OBJECTIVES. PAST PERFORMANCE IS NOT NECESSARILY INDICATIVE OF FUTURE RESULTS. THE PERFORMANCE QUOTED REPRESENTS PAST PERFORMANCE AND CURRENT PERFORMANCE MAY BE LOWER OR HIGHER. EQUITY TRADING IS SPECULATIVE AND MAY INVOLVE THE LOSS OF PRINCIPAL; THEREFORE, FUNDS PLACED UNDER MANAGEMENT SHOULD BE RISK CAPITAL FUNDS THAT IF LOST WILL NOT SIGNIFICANTLY AFFECT ONE'S PERSONAL WELL BEING. THIS IS NOT A SOLICITATION TO INVEST AND YOU SHOULD CAREFULLY CONSIDER YOUR FINANCIAL SITUATION PRIOR TO MAKING ANY INVESTMENT OR ENTERING INTO ANY TRANSACTION.
![]() BACK TO THE MAIN PERFORMANCE PAGE
BACK TO THE MAIN PERFORMANCE PAGE